New Functionality - Eye tracking
We are very happy to announce we have released a new functionality in FaceReader Online! It is now possible to use eye tracking to track where on the screen people are looking. We have been working on this technology for the last years and are very happy with the results. We believe this can be a great addition to solving your usability or marketing questions. Currently, the beta version is available for everyone to use at no additional costs. Read about the basic steps and technology in this blog.
Accuracy of the technology
Standard eye trackers use infrared cameras which increases the contrast and makes following the pupil of the eyes easier. Using a normal webcam thus is more challenging but with machine learning this becomes feasible. For more detailed information about the technology, read this blog.
The accuracy depends very much on the lighting, screen size, and other settings during testing. Our validation study showed that with optimal conditions the accuracy is about 5% of the screen. Another metric is that you can estimate with about 95% accuracy a location in 1/16th of the screen. It may not always work when people are wearing glasses and it is even more important to have good lighting conditions (see this blog ).
Practical steps to start using it in your project
In order to use gaze tracking in an experiment, start a new project and select FaceReader 9 for your engine (under details). To turn gaze tracking on, create an experiment and enable gaze tracking. Create an experiment the way you would normally do it by adding tasks. Note, it is now also possible to add an image as a task! When you add a media file (video or image) you can also create areas that will be used for calculating fixation time.
When you are ready with your experiment you can send an invitation to participants (or integrate it into a survey tool). When starting the project, the participant will see the standard consent confirmation, the video check, and the (optional) screen sharing confirmation. Then the participant will first start with a calibration session where they will have to follow and click the location of 13 dots. After the calibration, the first task will start.
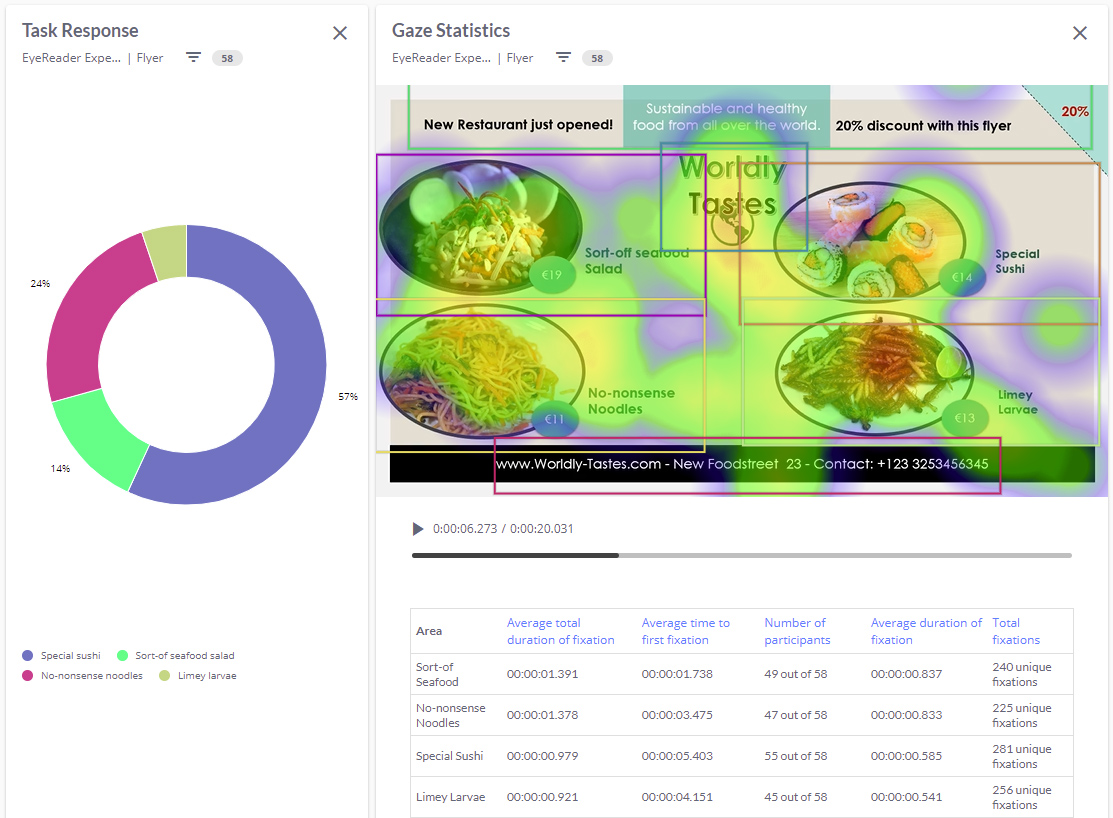
How to look at the results
When you completed your study, you can have a look at the results. You can look at the individual results, by going to recording results. You can see the gaze quality score in percentage deviation of the screen, a lower score means higher accuracy. Then go to view results and select append result view to add gaze. You can play the video to see the gaze or check out the area statistics. People only process information when they fixate and not when they move their eyes. Relevant metrics such as total fixations or total fixation duration are reported. For media files, you can also analyze group results and visualize the results with a heatmap. Go to group results and select gaze statistics. For website tasks, you can only look at the individual results, because the task duration is not the same for everyone.
The heatmap and gaze results can help track what captures the user’s attention. Do you have any questions about the technology or do you need help getting started, let us know!